
Cross specialty RCM benchmarking 2025 is not just another financial exercise. It is a turning point for medical groups. Think about how many times you have seen it. Claims slow down. Denials rise. Every team points in a different direction. Coding blames billing. Billing blames documentation. And leadership ends up guessing which fire to put out first.
Each specialty beats to its own rhythm. Cardiology runs on authorizations. Orthopedics lives by modifiers. Behavioral health survives on time-based codes. When you merge them all under one roof, you either create harmony or lose control. According to HFMA, administrative costs in healthcare are rising six to eight percent each year. That is not just inflation. It is inefficiency spreading quietly through the system. Benchmarking exposes it. It tells you where the money leaks before the damage spreads.
Why Cross Specialty Benchmarking Matters in 2025
What is the smartest way to keep control when payer rules change overnight? You measure faster than they move. CMS added new prior authorization edits in its 2025 Physician Fee Schedule. Cardiology and orthopedics are now among the highest-risk specialties for denials. Miss a single detail and your payment waits weeks. Cross specialty RCM benchmarking 2025 works best when data from every source is unified and compared consistently across departments.
At the same time, MGMA reports that multi-specialty consolidation is accelerating. Groups merge to save money, but their systems rarely merge cleanly. Data stays scattered. Reports stop matching. And without unified benchmarks, one department’s weak process can drag the rest into a backlog. Benchmarking brings visibility. It shows what is working and what is not. It turns noise into clarity.
Core RCM KPIs Every Multi-Specialty Practice Should Track
| Metric | 2025 Benchmark | Why It Matters |
|---|---|---|
| Clean Claim Rate | 97–99% | Confirms billing accuracy before submission. |
| Denial Rate | <5% | Detects payer and coding problems early. |
| Days in AR | <35 days | Tracks the speed of your cash flow. |
| Net Collection Rate | 95–98% | Shows how much of your revenue you actually keep. |
| First Pass Resolution | >90% | Measures claim quality and process strength. |
| Cost to Collect | <4% | Reveals administrative efficiency. |
According to MGMA, practices that keep AR days under 35 enjoy 25 percent stronger cash flow. Those numbers matter. They are the pulse of your RCM health. But numbers alone mean nothing without insight. A clean claim rate of 95 percent might sound strong, but what if it hides recurring errors from one payer? A denial rate of seven percent could be caused by a single modifier misused across hundreds of claims. Benchmarking turns random statistics into patterns that tell you what to fix first.
How RCM Benchmarks Differ by Specialty
Why does one department struggle while another thrives? Because each specialty fights its own billing war. The rules change, the codes shift, and the risks never look the same. Orthopedics battles modifiers. Cardiology wrestles with authorizations. Behavioral health navigates time and telehealth. Every specialty stands on a different battlefield. And benchmarking is the only way to see who is winning and who needs reinforcements.
| Specialty | Average AR Days | Denial Rate | Key Challenge |
|---|---|---|---|
| Orthopedics | 38–42 | 6–8% | Modifier and implant coding. |
| Cardiology | 36–40 | 7–9% | Pre authorization and bundling issues. |
| Behavioral Health | 32–35 | 4–6% | Time based CPT codes and telehealth billing. |
| Physical Therapy | 30–34 | 3–5% | Eight minute rule documentation. |
| Internal Medicine | 28–32 | 3–4% | High volume and coding complexity. |
According to AMA, orthopedics experiences nearly double the denial rate of internal medicine because of modifier errors. Yet most groups set the same expectations for both. That is like judging a marathon by sprint rules. Benchmarking by specialty ensures fairness. It sets the right pace for each team.
💡 Did You Know?
Most revenue leaks start small. A single modifier missed. A code left unchecked. One payer rule forgotten. Then it repeats. Over and over. According to HFMA, nearly 30 percent of claim rework happens because the same simple mistakes slip through across departments. Small errors. Big cost. MGMA found that practices using cross specialty benchmarks catch those leaks 40 percent faster. Why? Because they see everything side by side. Patterns that stay invisible in isolation become obvious in comparison. And here is the real surprise. CMS reports that improving your clean claim rate by just one percent can add roughly $25,000 in annual revenue per provider. One percent.
That is the difference between catching errors and chasing them. So ask yourself. What tiny mistake is quietly draining your revenue right now?
2025 Industry Trends Impacting RCM Benchmarks
How did revenue cycle management shift so dramatically? Because technology finally caught up with policy. And when that happened, everything changed. For years, practices were stuck in the middle. Payers moved faster than systems. Rules evolved before staff could adapt. But now the tools have caught up. The gap is closing. The pressure is higher than ever.
CMS Prior Authorization Final Rule (Effective 2026)
Electronic approvals are becoming mandatory. No more fax machines or endless call queues. Decisions will move through digital systems with firm response timelines. Practices that automate early will move smoothly. The rest will race to keep up when the rule takes effect. According to CMS, the goal is simple: reduce friction and speed up payments. But only practices prepared to integrate will benefit.
MIPS MVP Reporting 2025
Performance will finally be measured by specialty. Cardiology. Orthopedics. Behavioral health. Each will stand on its own results. No more hiding behind group averages. Benchmarking becomes a requirement, not a choice. MGMA calls it a new era of accountability. If you cannot measure by specialty, you cannot compete by specialty.
AI and Automation
Artificial intelligence is already rewriting the rules. Systems now scan, code, and flag claim errors before staff even touch them. According to AMA, AI-assisted editing improves first pass rates by up to 15 percent. That means cleaner claims, fewer denials, and faster reimbursements. The best RCM teams are not bigger anymore. They are smarter and supported by technology that never sleeps.
Interoperability
Data walls are coming down. EHRs and clearinghouses now share information instantly. Payer responses return in real time instead of days later. HFMA reports that connected data systems have cut administrative lag by nearly one third. That kind of speed changes everything. Benchmarking no longer happens after the fact. It happens live.
Integrated Dashboards
Visibility has become the new advantage. Centralized dashboards show leaders everything at once: clean claim rates, denial spikes, AR by payer. There is no waiting for reports. No guessing. Just clarity. According to HFMA, practices that use unified dashboards reduce AR days by up to 30 percent. That is more than efficiency. It is control.
Technology has taken the driver’s seat in RCM. Policy writes the rules, but technology sets the pace. The message is clear. Visibility wins. Data must move as fast as the regulations. In 2025, hesitation costs money, and the winners will be those who adapt first.
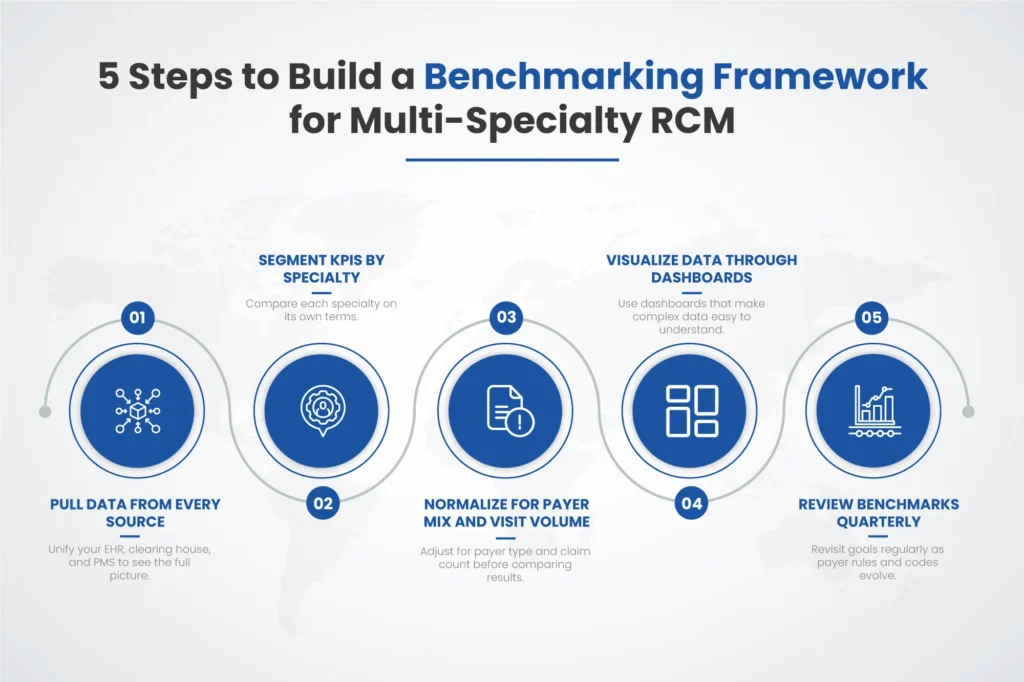
How to Build a Benchmarking Framework for Multi-Specialty RCM
Step 1: Pull data from every source
Bring everything together. Your EHR, your clearinghouse, your PMS. They all hold pieces of the same puzzle. One claim may look clean in your EHR but show an error in the clearinghouse. Another might pass the scrubber but stall in payer review. When you centralize it all, the truth becomes visible. Every denial. Every delay. Every dollar waiting to be collected. According to HFMA, unified data reduces reporting time by nearly 40 percent. That means fewer blind spots and faster answers.
Step 2: Segment your KPIs by specialty
Do not blend cardiology with orthopedics or behavioral health. Each specialty speaks its own financial language. Cardiology is authorization-heavy. Orthopedics relies on surgical modifiers. Behavioral health deals with time-based CPT codes and telehealth rules. Mix them, and your numbers lose meaning. Segmenting KPIs by specialty lets you see where each team stands. It also reveals where process differences create bottlenecks. The patterns appear fast when the noise is gone.
Step 3: Normalize for payer mix and visit volume
Fair comparison matters. A practice that handles 80 percent Medicaid cannot be compared to one that handles mostly commercial payers. Volume also skews results. Ten denials out of one hundred claims looks bad. Ten out of a thousand looks excellent. Normalization adjusts those imbalances. It turns raw data into reliable insight. According to MGMA, unnormalized metrics can exaggerate underperformance by as much as 25 percent. Normalizing protects you from drawing the wrong conclusions.
Step 4: Visualize your data through dashboards that anyone can read
Numbers mean nothing if people cannot understand them. Dashboards turn data into clarity. One glance should show clean claim rates, AR days, and denial trends. Red means attention. Green means flow. The goal is not beauty. It is speed of understanding. HFMA found that leaders using visual dashboards make RCM decisions three times faster than those relying on static reports. Data should feel alive, not buried in spreadsheets.
Step 5: Review benchmarks quarterly and adjust goals as regulations shift
RCM is never still. Payer rules change. Code edits evolve. Staffing patterns shift. Benchmarks that made sense in January might be outdated by July. Reviewing quarterly keeps your goals relevant and your team accountable. It also builds rhythm. Everyone knows when the next check-in is coming, and everyone prepares for it. According to CMS, practices that conduct quarterly performance reviews reduce denial rates by 12 percent within a year.
Building a benchmarking framework is not about adding work. It is about building vision. Each step tightens the system. Each review sharpens awareness. When every department follows the same data truth, revenue stops leaking and starts growing.
Why Context Still Matters in Cross specialty RCM benchmarking
Data gives direction, but people make the change. When denials rise, it is easy to blame staff or software. But sometimes it is neither. Sometimes the payer updates a rule quietly. Sometimes documentation misses a new code requirement. Benchmarking gives context to those moments. It shows trends before they explode into problems.
According to CMS, about 30 percent of claim delays stem from missing or outdated documentation, not from billing errors. That means most of it is preventable. Ask yourself what really drives the pattern. Is it training? Process? Payer policy? Benchmarking helps you answer those questions before the damage multiplies.
Common Benchmarking Mistakes to Avoid
What ruins benchmarking faster than bad data? Bad habits. Data tells the story, but habits decide how it ends. You can have perfect reports and still make the wrong calls if you read them carelessly. Rushed analysis. Unchecked assumptions. Ignored trends. They all turn insight into noise. Good benchmarking demands discipline. It rewards patience. It punishes shortcuts.
So where do most teams slip? Right here.
- Comparing different payer categories such as Medicaid and commercial.
- Ignoring seasonal fluctuations that change visit volume.
- Mixing CPT groups between specialties.
- Focusing only on payments instead of authorization and submission speed.
MGMA found that 40 percent of practices misread their benchmarks because they did not normalize payer mix. Clean data means clean insight. Benchmarking is not about comparing departments for competition. It is about aligning them for growth.
How Pro-MBS Helps Multi-Specialty Practices Optimize RCM Benchmarks
What happens when benchmarking becomes part of daily strategy? Revenue rises and stress falls. At Pro-MBS, we help multi-specialty practices transform raw data into action. Our analytics reveal payer patterns, denial trends, and collection gaps by specialty. Imagine opening one dashboard and seeing it all. Orthopedics slowing cash flow. Cardiology exceeding first pass goals. Behavioral health climbing in telehealth denials. The story becomes clear.
Our clients consistently achieve:
- 98.9% Clean Claim Rate
- 30% Faster Reimbursements
- 17.6% Revenue Growth
HFMA research shows that automation combined with benchmarking cuts manual claim rework by 25 to 30 percent. That means fewer mistakes, faster cash, and less wasted effort. Benchmarking turns confusion into confidence. So what is the real question? Which specialty slows your collections? Which one sets the bar? And what would happen if every team met that same standard? The answer already exists inside your data. Cross specialty RCM benchmarking 2025 is how you bring it to light. You cannot fix what you cannot see. But once you see it, everything changes.
FAQs
What are the KPI used in evaluating the effectiveness of RCM?
The key KPIs in cross specialty RCM benchmarking include clean claim rate, denial rate, days in AR, and first pass resolution rate. These metrics show how efficiently your multi-specialty practice manages cash flow, compliance, and payer performance.
What is KPIs in medical billing?
In medical billing, KPIs are measurable indicators that track the strength of your revenue cycle management. Monitoring metrics like claim turnaround time, cost to collect, and net collection rate helps uncover trends through benchmarking and automation.
What are the 7 steps of RCM?
The seven steps of RCM are patient registration, eligibility verification, charge capture, claim submission, payment posting, denial management, and reporting. Each one can be refined through data-driven benchmarking and process automation to reduce AR delays.
What are the disadvantages of RCM?
Without structured benchmarking or automation, RCM can become fragmented and error-prone. Inconsistent data, manual workflows, and missing documentation often slow revenue recovery across multi-specialty practices.
What is the RCM methodology?
The RCM methodology focuses on optimizing every stage of patient-to-payment workflow. Using cross specialty RCM benchmarking, practices compare KPIs across departments to find weak points, improve efficiency, and strengthen payer compliance.
What is RCM KPI?
An RCM KPI measures the overall financial and operational health of your revenue cycle. Metrics like clean claim rate, denial rate, and AR days reveal how effectively your benchmarking framework maintains accuracy and stability.
What is an RCM professional?
An RCM professional manages billing, coding, and collection workflows within a practice. Their role includes tracking KPIs, reducing denials, and applying cross specialty RCM benchmarking insights to improve efficiency and profitability.