

Your medical practice generated $240,000 in charges last month and collected $178,000 in payments. At first glance, those numbers might seem encouraging.
But how much of that revenue was actually collectible? How many claims were denied? Which insurance companies are taking longer to pay? And how much money is sitting in accounts receivable without a clear resolution?
A monthly billing report that only shows charges and payments cannot answer these questions.
Practice owners need a clearer understanding of what is happening between providing patient care and receiving reimbursement.
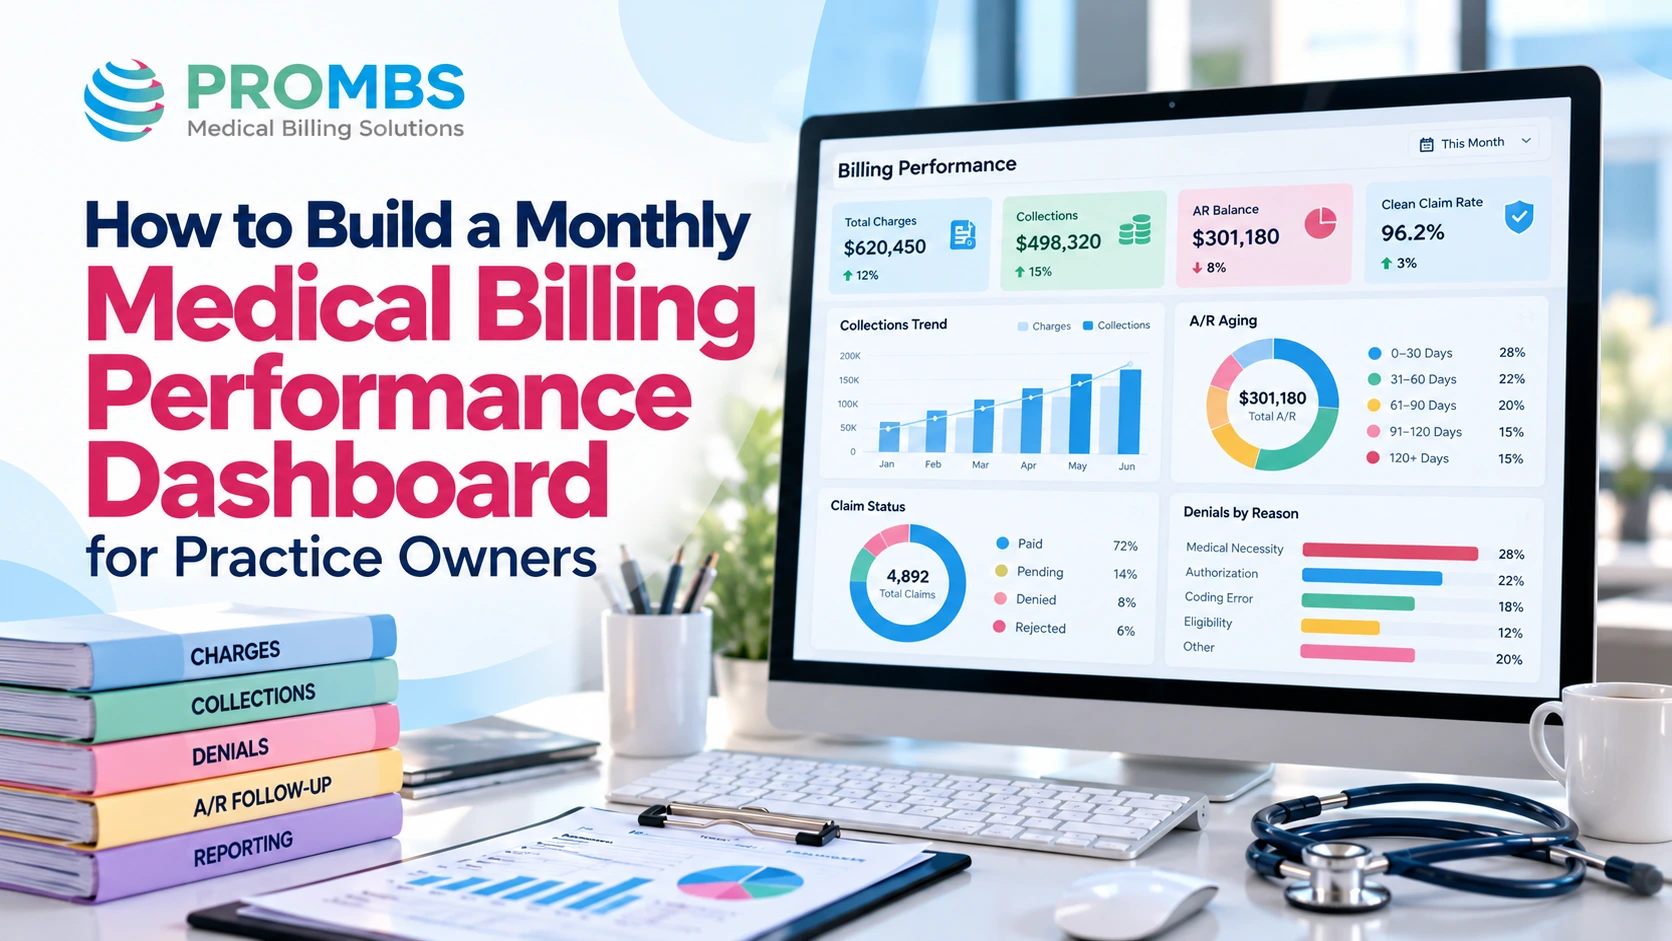
A medical billing performance dashboard brings the most important revenue cycle metrics into one organized report, helping healthcare providers understand their financial performance without reviewing hundreds of individual claims.
Instead of simply showing how much money came in, a useful dashboard explains where reimbursement is delayed, what is causing the problem, and which actions deserve attention.
This guide explains how to build a monthly dashboard that gives medical practice owners meaningful financial visibility, starting with the metrics that matter most.
What Is a Medical Billing Performance Dashboard?
A medical billing performance dashboard is a visual reporting tool that tracks key medical billing and revenue cycle metrics, including collections, claim quality, denial rates, accounts receivable, and payer performance.
It combines information from billing software, electronic health records (EHRs), clearinghouses, and payment records to provide a clearer picture of how efficiently a practice collects reimbursement.
A typical medical practice processes several types of financial information every day.
These include patient charges, insurance claims, payments, contractual adjustments, denials, and outstanding balances.
When this information is spread across different reports, practice owners may struggle to identify which issues are affecting collections.
A dashboard organizes these measurements into a single view.
For example, instead of opening separate reports to check unpaid claims and insurance denials, an owner can review both metrics together to determine whether increasing denials are contributing to aging accounts receivable.
A practical monthly dashboard should answer five questions:
- How much revenue did the practice generate and collect?
- Are claims being submitted accurately and paid without unnecessary rework?
- Which billing problems are causing denials or delays?
- How much reimbursement remains outstanding?
- Which payers, providers, or services require closer attention?
The dashboard does not replace detailed financial reports. It helps practice owners understand those reports and identify where further investigation is needed.
Pro Medical Billing Solutions (PROMBS) supports this approach through its medical billing performance dashboard and revenue cycle reporting services, which include KPI tracking, payer performance reports, denial analysis, and customized reporting.
Our goal is to help healthcare providers understand not only how much they are collecting, but also where their revenue cycle can be improved.
Why Practice Owners Need Monthly Billing Reports
Medical practices often monitor bank deposits, patient appointments, and overall collections to understand financial performance.
While these numbers are important, they do not provide a complete picture of billing efficiency.
A practice may experience an increase in monthly collections while its denial rate is also rising.
Another practice may have a healthy clean claim rate but struggle with delayed reimbursements from one major insurance payer.
Without comparing multiple metrics, these problems can remain unnoticed until they affect cash flow.
Monthly Reports Help Identify Revenue Problems Earlier
Consider a practice that collected $150,000 in August and $158,000 in September.
The increase appears positive.
However, a closer review reveals that claims denied during September increased significantly, and a growing percentage of outstanding insurance balances is now more than 90 days old.
The practice may be collecting payments from earlier claims while newer billing problems accumulate.
A medical billing KPI dashboard helps reveal this difference.
Instead of relying exclusively on collections, the owner can examine claim acceptance, denial trends, aging balances, and payment performance together.
Better Reporting Supports Better Financial Decisions
A useful billing dashboard should help practice owners decide where to direct their resources.
For example, recurring coding denials may indicate the need for documentation or coding review.
Increasing A/R days may suggest that payer follow-up is taking longer than expected.
A concentration of underpayments from one insurer may justify a more detailed contract and reimbursement investigation.
These decisions become easier when billing performance is measured consistently.
The Healthcare Financial Management Association (HFMA) maintains standardized revenue cycle performance indicators known as MAP Keys. These measurements help healthcare organizations evaluate different stages of the revenue cycle using consistent definitions.
At PROMBS, we help practices connect billing data with practical revenue cycle improvements through claim monitoring, denial management, payment posting, and A/R follow-up.
What Should a Medical Billing Dashboard Include?
A useful dashboard does not need dozens of charts or complicated financial calculations.
For most independent medical practices, a small number of carefully selected metrics can provide a reliable starting point.
The most important measurements should cover revenue collected, claim quality, payer denials, outstanding balances, and reimbursement performance.
Monthly Charges, Collections and Net Collection Rate
The first section should show how much the practice billed and how much money it received.
Monthly charges represent the value of services recorded in the billing system during the reporting period.
Monthly collections represent payments received or posted during that period, depending on the reporting method.
Both figures help owners understand financial activity, but they should not automatically be compared as if they relate to exactly the same services.
For example, payments received in September may include claims for services performed in July or August.
This is why net collection rate is important.
Net collection rate measures how much of the practice’s collectible revenue was actually collected after accounting for contractual allowances.
A commonly used formula is:
Net Collection Rate = (Payments Collected ÷ Expected Collectible Revenue) × 100
Expected collectible revenue is based on applicable allowable amounts, rather than gross charges that include contractual discounts.
Payments and expected revenue must be measured for a consistent set of services, preferably allowing sufficient time for claims to be processed.
For example, if a completed group of claims has $100,000 in expected collectible reimbursement and the practice collects $96,000, its net collection rate for that group is 96%.
The Medical Group Management Association (MGMA) identifies net collection percentage as an important measure of medical practice financial performance.
Practice owners should monitor this metric over time rather than drawing conclusions from a single month.
PROMBS supports practices through payment posting, reimbursement review, and revenue cycle reporting that help distinguish actual collections from contractual adjustments and outstanding balances.
Clean Claim Rate and First-Pass Resolution
A practice may submit hundreds of claims each month, but the number submitted does not establish how accurately they were prepared.
Two important metrics help measure claim quality.
Clean claim rate measures the percentage of claims that pass the billing system’s applicable edits without requiring manual correction.
Using the HFMA MAP Keys definition:
Clean Claim Rate = (Claims Passing Edits Without Manual Intervention ÷ Claims Entering the Claims Processing Tool) × 100
For example, if 950 out of 1,000 claims pass the applicable edits without intervention, the clean claim rate is 95%.
However, a clean claim does not automatically guarantee payment.
First-pass resolution rate is commonly used to measure the percentage of claims successfully paid or resolved as expected without requiring correction, resubmission, or appeal.
Its exact definition can vary by billing system, so practices should establish a consistent calculation and evaluate claims after sufficient adjudication time.
A practice could have a high clean claim rate while experiencing a lower first-pass payment rate because of coverage or authorization problems.
Both measurements belong on the dashboard because they identify problems at different stages.
Through its medical billing services, PROMBS supports claim scrubbing, electronic submission monitoring, and billing corrections to help practices reduce avoidable rejections and reimbursement delays.
Claim Denial Rate and Top Denial Reasons
Claim denials are among the most useful warning indicators in a monthly billing report.
A rising denial rate can reveal problems involving patient eligibility, coding, documentation, authorization, or payer processing.
Denial rate measures the percentage of adjudicated claims that receive a denial, using a clearly defined reporting method.
For example, the HFMA remittance denial rate uses actionable denied claims divided by total claims remitted during the period.
If 75 out of 1,500 adjudicated claims meet the defined denial criteria, the rate is 5%.
However, the percentage alone does not explain the underlying problem.
A useful dashboard should also show the most common denial categories, including:
- Eligibility and patient information errors.
- Missing or mismatched prior authorizations.
- Coding and modifier issues.
- Medical necessity denials.
- Provider enrollment or credentialing problems.
Front-end claim rejections should be tracked separately from denials received after adjudication.
This distinction allows owners to identify whether problems originate before claim processing or during the payer’s payment determination.
For example, a sudden increase in authorization denials may indicate that scheduled procedures are being performed without confirming the approved details.
PROMBS’s denial management services help practices investigate these trends, identify recurring causes, and pursue appropriate claim corrections or appeals.
The goal is not simply to reduce the number of denials recorded in a report. It is to address the issues creating them.
Days in A/R and Aging Balances
Accounts receivable, commonly called A/R, represents outstanding payments owed to a medical practice.
A practice can generate substantial charges and still experience cash flow difficulties when those balances remain unpaid.
Days in A/R estimates how many days of net patient service revenue are represented by outstanding net receivables.
The HFMA net days in A/R calculation uses:
Net Days in A/R = Net Accounts Receivable ÷ Average Daily Net Patient Service Revenue
A higher value may indicate that more revenue is tied up in outstanding accounts, although changes in payer mix, revenue, and reporting methods also affect the result.
Practice owners should review this metric alongside the age of unpaid balances.
Common A/R aging categories include 0–30, 31–60, 61–90, 91–120, and over 120 days.
The dashboard should identify how much outstanding revenue falls into each category and what percentage of billed A/R is older than 90 days.
For example, suppose a practice has $120,000 in outstanding billed A/R, with $36,000 remaining unpaid for more than 90 days.
That means 30% of its billed A/R is over 90 days old.
This should prompt further investigation into the affected claims, payers, and reasons for nonpayment.
However, old A/R does not automatically represent permanently lost revenue. Some claims may remain recoverable through appropriate follow-up.
PROMBS supports practices through aging analysis, insurance follow-up, denial investigation, and outstanding claim management.
Monitoring these metrics helps identify which accounts require attention before they become more difficult to collect.
Payer Performance and Underpayments
Not every insurance company processes claims at the same speed or reimburses services under the same contractual arrangements.
A practice may receive timely payments from one payer while experiencing delays, denials, or payment discrepancies from another.
A monthly dashboard should help owners compare payer performance using consistent information.
Useful measurements include average payment turnaround, denial frequency, outstanding A/R, and potential underpayments by payer.
For example, if one insurer consistently takes longer to process comparable claims, the practice should investigate whether the delay results from payer processing, claim errors, or missing documentation.
Underpayments deserve separate attention.
An underpayment may occur when a payer reimburses less than the amount legitimately due under the applicable contract or payment rules.
However, receiving less than the original billed charge does not automatically mean a claim was underpaid.
The billing team must compare actual reimbursement with the expected allowable amount and account for contractual adjustments and patient responsibility.
PROMBS provides reporting and payment reconciliation support that helps practices investigate payer performance and identify potential reimbursement discrepancies.
A well-organized medical billing performance dashboard makes these issues easier to identify before small differences become recurring financial problems.
Common Reporting Gaps That Hide Practice Revenue Problems
Even when a practice tracks the right KPIs, inaccurate or incomplete reporting can lead to poor decisions.
The following problems are especially important to avoid.
Focusing Only on Total Collections
Monthly collections show how much money was received, but they do not explain whether claims are being processed efficiently.
A practice may collect more money because of higher patient volume while simultaneously experiencing an increase in denials.
Owners should examine collections alongside claim quality, A/R aging, and reimbursement trends.
Combining Claim Rejections and Denials
A claim rejected before adjudication is different from a claim denied after payer processing.
Combining these categories makes it harder to determine whether the practice has a claim submission problem or a payment determination problem.
Each should have its own measurement and follow-up process.
Using Inconsistent Reporting Definitions
A dashboard becomes unreliable when its calculations change from month to month.
For example, if one report measures denial rate by individual service lines while another measures it by claims, comparing the two percentages may produce misleading conclusions.
Practices should define every KPI clearly, use consistent reporting periods, and document which data sources are used.
HFMA specifically emphasizes consistent data definitions and sources when measuring revenue cycle performance.
Overlooking Unbilled Encounters and Charge Lag
Not every revenue problem appears in an A/R report.
A completed patient visit may remain unbilled because the clinical note is unfinished or the charge was never entered.
If the claim was never created, its expected reimbursement may not appear in traditional billed A/R.
A complete billing reporting process should therefore include visibility into unbilled encounters and delays between the date of service, charge entry, and claim submission.
Reporting Numbers Without Explaining What They Mean
A dashboard showing that the denial rate increased from 4% to 7% is useful, but practice owners also need to know why the change occurred.
Was the increase concentrated in one payer? Did a coding rule change? Were authorizations missing for particular procedures?
A meaningful monthly report should identify the issue, its potential financial impact, and the recommended next action.
Pro Medical Billing Solutions helps practices connect reporting with revenue cycle operations through coding support, denial analysis, payer follow-up, and billing audits.
Our focus is on turning financial information into practical improvements rather than providing reports that simply display numbers.
Building an effective medical billing performance dashboard starts with choosing the right measurements. The next step is organizing those measurements into a clear, repeatable reporting structure that practice owners can review every month.
How to Build a Medical Billing Performance Dashboard Step by Step
To build a medical billing performance dashboard, start by collecting reliable billing data, selecting the most important KPIs, defining consistent calculations, organizing the information into a simple layout, and comparing results over time.
The goal is not to create a complicated reporting system. It is to give practice owners a clear understanding of how efficiently their services are turning into collected revenue.
A dashboard should help answer practical questions: Are payments arriving on time? Are denials increasing? Which insurance companies are causing delays? And what should the billing team address first?
A reliable medical billing performance dashboard makes these answers easier to find without requiring practice owners to review individual claims every day.
Step 1: Collect Data From Your EHR, Billing System and Clearinghouse
The first step is identifying where the practice’s billing information is stored.
Most medical practices use an electronic health record (EHR), a practice management or billing system, and a clearinghouse to process claims. Payment information may also appear in electronic remittance advice files and accounting records.
Each system provides a different part of the revenue cycle.
The EHR helps identify completed patient encounters, documentation status, and services performed.
The billing system contains charges, claim records, adjustments, payments, and outstanding accounts.
The clearinghouse provides submission information, including rejected claims and claim acceptance responses.
Electronic remittance advice, commonly received through the 835 transaction, shows how payers processed claims, including payments, denials, and adjustments.
According to the Centers for Medicare & Medicaid Services, the 835 allows providers to identify payment amounts and the reasons for adjustments at the claim or service level.
When creating the dashboard, these records should be connected using consistent claim, encounter, payer, and service information.
For example, a claim reported as denied in the billing system should be traceable to the payer’s actual remittance response.
This helps avoid duplicate counts and incorrect financial reporting.
Before building charts, verify that the underlying data reconciles with the practice’s billing and accounting records.
Pro Medical Billing Solutions (PROMBS) supports healthcare providers through claim tracking, payment posting, and revenue cycle reporting. Our reporting approach helps connect billing activity with reimbursement outcomes so practice owners can understand what is happening across the revenue cycle.
Step 2: Select the Most Important Billing KPIs
A common mistake is trying to display every available billing metric on one dashboard.
A report containing dozens of numbers can make it difficult for practice owners to identify what actually matters.
Start with the core measurements discussed in Part 1:
- Monthly collections and charges.
- Net collection rate.
- Clean claim rate and first-pass resolution.
- Claim denial rate and leading denial reasons.
- Net days in accounts receivable and A/R aging.
- Payer performance and potential underpayments.
These measurements cover financial activity, claim quality, reimbursement delays, and outstanding revenue.
Practices can add supporting metrics when a specific problem requires closer investigation.
For example, if clinical documentation delays are causing late submissions, the dashboard may need to track charge lag and unbilled encounters.
If one insurance company is consistently underpaying claims, the practice may need a separate payer reimbursement analysis.
The most useful KPIs are those that support an operational decision.
PROMBS’s revenue cycle KPI guide explains the importance of tracking billing measurements consistently. A monthly dashboard builds on those metrics by showing how they change and which areas require attention.
Step 3: Define Consistent KPI Formulas and Reporting Periods
A dashboard is only reliable when the practice calculates its metrics the same way every month.
For example, monthly collections are commonly measured according to payments posted during the reporting period.
However, those payments may relate to services performed in previous months.
A practice should therefore avoid calculating net collection rate by simply dividing September payments by September charges.
The two amounts may represent different groups of patient services.
For an accurate net collection analysis, payments should be compared with the expected collectible revenue associated with a consistent group of claims.
Similarly, the denial rate should use a defined unit of measurement.
If the practice calculates its denial rate at the claim level, it should not switch to service-line counting the following month without explaining the change.
The HFMA MAP Keys provides standardized definitions for several revenue cycle measurements, including clean claim rate, remittance denial rate, and net days in A/R.
For example:
Clean Claim Rate = (Claims Passing Edits Without Manual Intervention ÷ Claims Entering the Claims Processing Tool) × 100
Remittance Denial Rate = (Actionable Denied Claims ÷ Total Claims Remitted) × 100
Net Days in A/R = Net Accounts Receivable ÷ Average Daily Net Patient Service Revenue
Under HFMA’s methodology, average daily net patient service revenue for net days in A/R uses the most recent three-month period.
For reporting accuracy, the dashboard should identify the data source, reporting period, calculation method, and any important exclusions for each KPI.
A monthly report can then compare performance without creating misleading differences caused by changes in calculation methods.
Step 4: Organize Dashboard Sections and Visualizations
Once the data and calculations are ready, organize the dashboard so practice owners can understand the most important information quickly.
A practical layout can have four sections.
Revenue Overview
The top section should display monthly charges, collections, net collection performance, and major changes from the previous month.
These numbers help owners understand the practice’s overall billing activity.
Claims and Denials
The next section should show the clean claim rate, first-pass resolution, denial rate, and leading denial categories.
For example, a simple bar chart can compare eligibility, authorization, coding, and medical necessity denials.
This helps the practice identify which problems are creating the most rework.
Accounts Receivable
The A/R section should display net days in A/R, aging categories, and balances requiring follow-up.
A stacked bar chart can show the distribution of outstanding balances across 0–30, 31–60, 61–90, 91–120, and over 120 days.
Payer Performance
The final section should compare major insurance payers according to payment turnaround, denial trends, and outstanding balances.
This allows practice owners to recognize whether billing delays are concentrated among particular insurers.
The dashboard should also include a brief summary of the most important findings and recommended actions.
For example, “Authorization denials increased this month; review the affected payer and procedure groups” is more useful than simply displaying a higher denial percentage.
Avoid unnecessary visual effects or complicated charts. Clear labels, consistent reporting periods, and readable numbers should take priority.
A dashboard containing patient-level details must also be handled securely. The HHS HIPAA minimum necessary guidance explains the need to limit unnecessary access to protected health information.
For owner-level reporting, aggregated financial and operational information is often sufficient. Detailed claim records should be available only to appropriately authorized staff.
Step 5: Compare Monthly Results and Identify Trends
A single month’s performance does not always reveal whether a practice’s revenue cycle is improving.
For example, monthly collections may decline because of seasonal patient volume, changes in service mix, or payer processing delays.
One lower collection month does not automatically indicate a billing failure.
The dashboard should therefore compare the current month with previous reporting periods.
Practice owners should examine whether denial rates are increasing, whether A/R is aging, and whether payments are keeping pace with expected reimbursement.
A three- to six-month trend can provide better context than comparing only two months.
For example, if denial rates increase for three consecutive months, the billing manager should investigate which payers and denial categories are contributing to the change.
Similarly, if clean claim rates remain stable but A/R days continue increasing, the problem may involve payer processing, follow-up, or payment reconciliation rather than initial claim preparation.
A well-designed medical billing performance dashboard should make these patterns visible before they become major collection problems.
PROMBS provides customized reporting, denial trend analysis, and payer performance monitoring through its revenue cycle management services. These reports help practice owners understand the reasons behind financial changes rather than relying on individual metrics alone.
Example of a Monthly Medical Billing Dashboard
Consider a four-provider medical practice reviewing its billing performance for September 2026.
The practice has collected more revenue than the previous month, but several important billing indicators are moving in the wrong direction.
Its monthly dashboard might show the following results.
Sample Monthly Billing Performance Report
| KPI | August 2026 | September 2026 |
|---|---|---|
| Monthly collections | $152,000 | $164,000 |
| Clean claim rate | 95% | 93% |
| Remittance denial rate | 4.0% | 6.0% |
| Net days in A/R | 38 days | 44 days |
| Billed A/R over 90 days | 18% | 23% |
| Unbilled encounters at month-end | 21 | 39 |
These figures are illustrative and do not represent actual PROMBS client performance. Collections are measured by payment posting month, while A/R and unbilled counts are month-end snapshots. Denial rates use the same claim-level definition in both periods.
What Do These Results Tell the Practice Owner?
At first glance, the practice appears to be doing well.
Monthly collections increased from $152,000 to $164,000, an improvement of approximately 7.9%.
However, other metrics reveal potential problems.
The clean claim rate declined from 95% to 93%, meaning a larger percentage of claims required intervention during the initial billing validation process.
The remittance denial rate increased from 4% to 6%, suggesting that more adjudicated claims required corrective action.
Net days in A/R increased from 38 to 44 days, while the percentage of billed receivables older than 90 days rose from 18% to 23%.
These changes suggest that reimbursement delays may be growing even while total payments are increasing.
The number of unresolved unbilled encounters also increased from 21 to 39, indicating that additional services may be waiting for documentation, charge entry, coding, or claim submission.
The practice should investigate these changes rather than concluding that its billing performance improved solely because collections increased.
What Should the Owner Ask the Billing Team?
The owner should request an explanation of the most significant changes.
For example, which payers contributed most to the increase in denials? Are older balances concentrated in particular service categories? Why did the number of unbilled encounters increase?
Each question should lead to a specific investigation.
If authorization denials are rising, the billing team should review approval records and claim information.
If aging A/R is increasing, staff should identify claims approaching filing or appeal deadlines and prioritize legitimate recovery opportunities.
If unbilled encounters are accumulating, the practice should examine clinical documentation and charge capture workflows.
This is what makes a dashboard useful. It turns financial measurements into questions that lead to corrective action.
How to Identify Revenue Leakage Using Dashboard Data
Revenue leakage occurs when a healthcare practice fails to capture or collect reimbursement it is legitimately entitled to receive.
Some revenue problems begin before a claim is submitted, while others appear during payer adjudication, payment posting, or accounts receivable follow-up.
A dashboard helps practices recognize warning signs that may otherwise remain hidden across different reports.
Identify Unbilled Services and Charge Lag
A medical practice may see patients and provide services without completing the billing process for every eligible encounter.
This can happen because of unsigned clinical notes, missing charges, or delays between the EHR and billing system.
If the dashboard shows an increasing number of unbilled encounters, the practice should compare completed visits with recorded charges and submitted claims.
For example, a sudden increase in encounters pending longer than the practice’s normal documentation period may indicate a workflow problem.
However, not every unbilled encounter represents collectible revenue. Some services may be bundled or legitimately nonbillable.
The purpose is to identify missing billing opportunities and resolve avoidable delays.
Detect Underpayments and Payer Discrepancies
A payer may process a claim and issue payment, but the amount may differ from what the practice expected under its contract.
For example, suppose eight claims appear to have been underpaid by $75 each.
That represents $600 in potential reimbursement differences requiring investigation.
The billing team should verify the contracted allowable amount, relevant adjustments, and any payment rules before classifying those differences as underpayments.
If the discrepancies are valid, the practice may have an opportunity to pursue additional reimbursement through the payer’s permitted process.
PROMBS supports payment posting, remittance reconciliation, and underpayment review through its medical billing services.
These activities help practices determine whether differences between billed charges and actual payments are legitimate contractual adjustments or potential collection opportunities.
Recognize Denial Patterns Before They Grow
One month of increased denials may not establish a recurring problem.
However, repeated increases involving the same payer, procedure, or denial category deserve investigation.
For example, a dashboard may show that medical necessity denials are concentrated among a particular group of diagnostic procedures.
The billing team should review the applicable payer policies, coding information, and clinical documentation to determine whether the problem originates before submission or during payer processing.
PROMBS’s denial management services support these investigations through root-cause analysis, payer follow-up, and appropriate claim correction or appeal activities.
The purpose of dashboard monitoring is to detect problems early enough to take meaningful action.
Common Mistakes When Building Medical Billing Reports
Even a professionally designed dashboard can mislead practice owners when the underlying data or presentation is inaccurate.
Using Too Many KPIs Without Clear Priorities
A dashboard containing 30 or 40 measurements may provide more information than the owner can reasonably review.
Start with the metrics that explain collections, claim quality, denials, and outstanding A/R.
Additional measurements should support a specific investigation rather than compete for attention on the main report.
Comparing Metrics With Different Definitions
A claim-level denial rate should not be compared directly with a service-line denial rate.
Similarly, gross charges should not be mistaken for expected collectible reimbursement.
The practice should use consistent formulas, document reporting methods, and clearly label financial amounts.
This is especially important when comparing results across multiple providers, locations, or billing systems.
Ignoring Data Quality and Reconciliation
A dashboard can show inaccurate collections when payments are posted to the wrong period, duplicate records are included, or adjustments are classified incorrectly.
Before publishing the monthly report, the billing team should reconcile key totals with the underlying financial records.
Exceptions should be investigated and documented rather than silently excluded.
Failing to Assign Responsibility for Problems
Reporting an increase in denied claims is not enough.
The practice should identify who will investigate the issue, what action is required, and when the results will be reviewed.
For example, a dashboard finding might lead to a review of authorization workflows, provider documentation, or payer follow-up practices.
Without accountability, the same problems can appear in consecutive monthly reports without meaningful improvement.
Treating Dashboard Reporting as a One-Time Project
A dashboard should evolve as the practice’s reporting needs change.
For example, an independent primary care practice may initially focus on basic collections, denials, and A/R.
As the organization grows, it may need additional reporting by provider, specialty, location, or payer.
The core calculations should remain consistent, while new measurements can be introduced when they support better decisions.
Pro Medical Billing Solutions helps healthcare providers connect reporting with operational improvements through medical billing, coding, denial management, and A/R follow-up.
Our reporting and analytics services help practices monitor financial performance and identify the billing issues that deserve attention.
A successful medical billing performance dashboard does more than display numbers. It gives practice owners a clear understanding of what is working, where revenue may be delayed, and which actions can improve billing performance.
How Practice Owners Should Review Their Dashboard Every Month
Creating a dashboard is only the first step. The real value comes from reviewing the numbers regularly and understanding what they reveal about the practice’s financial performance.
A practice owner does not need to investigate every unpaid claim personally. However, they should understand whether the billing team is collecting expected revenue, resolving denials, and keeping outstanding balances under control.
A monthly medical billing dashboard review should focus on three questions: What changed, why did it change, and what action is needed?
A consistent review process helps practice owners identify financial problems early instead of discovering them after several months of declining collections.
Start With a Monthly Revenue Summary
Begin by comparing the current month’s collections, charges, and other financial results with previous reporting periods.
For example, if collections increased by 8%, determine whether the improvement resulted from higher patient volume, payment of older claims, or more efficient reimbursement.
Likewise, a decline in collections does not always indicate a billing problem. Seasonal changes in appointment volume, payer mix, or delayed insurance processing may explain some fluctuations.
Practice owners should review financial activity alongside the underlying billing metrics before reaching conclusions.
A reliable medical billing performance dashboard helps connect these figures, making it easier to understand whether financial changes reflect normal operations or problems requiring investigation.
Review Claim Quality and Denial Trends
Next, examine whether the practice is submitting accurate claims and receiving appropriate payment.
Compare clean claim rates, first-pass resolution, and adjudicated denial rates with previous months.
For example, if the denial rate increases from 4% to 7%, the owner should ask which insurance companies and denial categories contributed to the increase.
The billing team may discover that authorization-related denials increased after scheduling changes or that a documentation issue is affecting a particular procedure.
This information can guide corrective action before the problem affects more claims.
Pro Medical Billing Solutions (PROMBS) helps practices investigate these issues through its denial management services, including payer trend monitoring, denial analysis, and appropriate claim follow-up.
Evaluate Outstanding Accounts Receivable
A/R performance should be reviewed alongside monthly collections.
An increase in net days in A/R or a growing percentage of older balances may indicate reimbursement delays that require attention.
Practice owners should ask whether the increase is concentrated among specific insurance payers, providers, or claim categories.
They should also determine whether the outstanding amounts represent legitimate collectible balances, pending claims, or adjustments that have not been posted correctly.
A detailed review helps distinguish recoverable insurance balances from amounts that do not require further collection efforts.
Turn the Review Into an Action Plan
Every monthly dashboard review should end with a few clearly defined priorities.
For example, if the practice identifies rising medical necessity denials, the next step may be to review the clinical documentation and payer policies associated with those claims.
If unbilled encounters are increasing, the billing manager may need to investigate incomplete documentation or delayed charge entry.
Each priority should have an assigned person, a target completion date, and an expected outcome.
During the next monthly review, the owner should verify whether those actions produced measurable improvement.
This makes dashboard reporting part of an ongoing management process rather than an administrative task completed once a month.
Which Billing KPIs Require Immediate Attention?
Not every change in a billing metric indicates a serious problem.
A small monthly fluctuation may result from normal variation in patient volume, claim complexity, or payer processing.
However, certain trends deserve closer investigation, especially when multiple indicators move in the wrong direction.
Practice owners should watch for the following warning signs.
| KPI warning sign | What the practice should investigate |
|---|---|
| Increasing denial rate | Payer policies, authorization, coding, and documentation |
| Declining clean claim rate | Registration errors, claim edits, and missing information |
| Rising days in A/R | Payer delays, unresolved denials, and insufficient follow-up |
| Growing A/R over 90 days | Aging claim recovery, appeal deadlines, and underpayments |
| Increasing unbilled encounters | Documentation holds, missing charges, and submission delays |
| Repeated payer underpayments | Contractual allowances, payment posting, and reimbursement discrepancies |
These warning signs should be evaluated against the practice’s established performance targets and historical results.
There is no single threshold that accurately describes every specialty, payer mix, or medical practice.
When Denials Increase Despite Stable Claim Submission
A practice may maintain a strong clean claim rate but experience more denials after insurance companies process its claims.
This indicates that the billing system’s initial validation process may be working while other payment requirements are causing problems.
For example, claims may pass electronic edits but later be denied because of missing authorization, coverage restrictions, or medical necessity concerns.
The practice should investigate the actual denial reasons rather than assuming its claim scrubbing process is sufficient.
When A/R Aging Increases Despite Higher Collections
Higher monthly collections can be encouraging, but they do not necessarily mean the practice is collecting outstanding reimbursement efficiently.
For example, a practice may collect more money because patient volume increased while older insurance balances continue accumulating.
The billing manager should identify which accounts are aging, why they remain unpaid, and whether valid recovery opportunities are approaching their deadlines.
When Charge Lag and Unbilled Encounters Increase
A practice may have reasonable denial and payment performance while overlooking services that have not yet reached claim submission.
These gaps may not appear in traditional billed A/R reports.
Increasing charge lag or unresolved encounters should prompt a comparison between completed visits, entered charges, and submitted claims.
This helps identify revenue problems that begin before payer processing.
The purpose of a medical billing performance dashboard is not simply to identify unusual numbers. It is to show which financial and operational issues need investigation.
How to Turn Dashboard Findings Into Revenue Cycle Improvements
A dashboard becomes more useful when practices connect each important finding with an operational change.
For example, knowing that a payer’s denial rate increased is useful. Understanding why those claims were denied and changing the workflow responsible for the problem creates greater value.
Identify the Root Cause Before Making Changes
Suppose a medical practice notices a steady increase in authorization-related denials.
Management could respond by asking billing employees to follow up more frequently.
However, additional calls may not solve the underlying problem if the scheduling team repeatedly changes procedures or treatment locations without notifying the authorization department.
A better approach is to investigate where the authorization and final claim information stop matching.
The practice can then establish a process requiring authorization review when a relevant scheduling or treatment change occurs.
This reduces the likelihood that the same problem will affect future claims.
Set Measurable Improvement Targets
Once the root cause is identified, establish a realistic target.
For example, a practice with an increasing denial rate may aim to return to its previous performance level over the next several reporting periods.
A practice experiencing delayed charge entry may establish an internal target for resolving routine documentation holds.
Targets should reflect the organization’s service mix, staffing, payer requirements, and previous performance.
The practice should avoid adopting arbitrary industry benchmarks without confirming that the measurements and circumstances are comparable.
Review Whether Corrective Actions Worked
A revenue cycle improvement should be evaluated using actual performance data.
For example, if the billing team introduces an additional authorization review before claim submission, the following dashboard reports should show whether related denials declined.
If the problem continues, management may need to investigate additional causes.
PROMBS supports healthcare practices through coding reviews, denial analysis, claim tracking, and A/R follow-up.
By connecting reporting with day-to-day billing activities, our team helps practices identify opportunities for improvement and monitor whether corrective actions are producing results.
What Should a Monthly Medical Billing Performance Audit Include?
A monthly dashboard provides an overview of billing performance, while a billing audit examines the records and processes behind the reported numbers.
For example, a dashboard might show that net days in A/R increased from 38 to 44 days.
An audit would investigate which claims, payers, or workflow problems contributed to that increase.
A monthly billing performance audit should verify reporting accuracy, identify unusual trends, and determine whether the practice has unresolved reimbursement opportunities or process weaknesses.
Verify Financial and Billing Data Accuracy
The audit should confirm that charges, payments, contractual adjustments, and outstanding balances reconcile with the underlying records.
This includes checking whether payments were posted correctly and whether the same claim or transaction was counted more than once.
For consistent reporting, practices should retain source records and use the same calculation methods each month.
The HFMA MAP Keys provides standardized revenue cycle KPI definitions and emphasizes using consistent data sources for reporting.
Review Claims, Denials and Outstanding Balances
The audit should examine a relevant selection of submitted claims, rejected claims, adjudicated denials, and older receivables.
Billing teams should identify recurring problems involving registration, coding, documentation, authorization, and payer processing.
Potential underpayments should also be reviewed against applicable contracts and payment rules.
Not every unpaid balance represents recoverable revenue, so the audit should distinguish valid collection opportunities from contractual adjustments and noncovered services.
Investigate Revenue Missing Before Claim Submission
The review should also examine completed patient encounters that have not entered the billing process.
Comparing EHR encounter reports with charge entry and claim submission records can reveal missing charges or documentation delays.
This is particularly important because services that were never billed may not appear in the practice’s standard A/R aging report.
Prepare a Clear Audit Summary
The final audit report should explain which issues were identified, their potential financial impact, and the actions recommended to address them.
For example, the report may identify a recurring payer underpayment pattern or a concentration of claims delayed by incomplete documentation.
Practice owners should receive a concise summary rather than a large collection of unresolved claim records.
PROMBS offers medical billing and coding audit services to help practices examine billing accuracy, denial patterns, charge capture issues, and revenue cycle weaknesses.
An audit provides a more detailed investigation when dashboard results indicate that a problem needs attention.
How Pro Medical Billing Solutions Helps Practices Monitor Billing Performance
Managing a medical practice requires attention to patient care, staffing, expenses, compliance, and financial stability.
Practice owners should not have to review hundreds of claims to understand whether their billing operation is performing effectively.
Pro Medical Billing Solutions provides medical billing and revenue cycle management services for healthcare providers across the United States.
Our approach combines claim processing, payment posting, denial management, accounts receivable follow-up, and performance reporting to give practices better visibility into their revenue cycle.
Customized Billing Dashboards and KPI Reporting
PROMBS provides reporting and analytics support designed to help healthcare practices monitor collections, denial trends, payer performance, and provider productivity.
Through customized dashboards and KPI tracking, practice owners can review important financial information without relying exclusively on individual claim reports.
Our revenue cycle management services connect financial reporting with day-to-day billing activities, helping practices understand what is contributing to reimbursement delays.
This supports clearer communication between practice leadership and the billing team.
Denial Analysis and Payer Performance Monitoring
A dashboard may reveal an increasing denial rate, but resolving the problem requires understanding the reason.
PROMBS helps practices investigate denied claims, review payer responses, and identify recurring billing issues.
Our denial management process includes root-cause analysis, appropriate corrections, appeal support, and payer trend monitoring.
These activities help practices move beyond simply counting denials and focus on preventing avoidable payment problems.
Payment Posting, A/R Follow-Up and Revenue Tracking
Accurate payment posting is essential for reliable dashboard reporting.
If payments and adjustments are recorded incorrectly, a practice may misunderstand its actual collections and outstanding balances.
PROMBS supports electronic remittance reconciliation, payment posting, underpayment review, and insurance A/R follow-up.
Our billing team also helps practices investigate aging claims, monitor payer responses, and identify legitimate reimbursement opportunities.
These services support a more complete view of billing performance, from claim submission through payment resolution.
Billing Audits and Continuous Performance Improvement
Some billing problems remain hidden until an audit examines the underlying records.
PROMBS helps practices identify billing inconsistencies, coding issues, missing charges, and recurring denial patterns that may affect collections.
Our objective is to connect reporting with practical improvements.
A medical billing performance dashboard should help practice owners understand their financial results, while the billing team uses those findings to improve the processes responsible for reimbursement.
With organized reporting and ongoing revenue cycle support, practices can make better-informed financial decisions without losing focus on patient care.
Frequently Asked Questions About Medical Billing Performance Dashboards
What is a medical billing performance dashboard?
A medical billing performance dashboard is a reporting tool that displays important revenue cycle measurements, including collections, claim quality, denial rates, accounts receivable, and payer performance.
It helps practice owners understand financial trends and identify billing problems that require attention.
Which KPIs should a medical practice owner track monthly?
The most useful starting metrics include monthly collections, net collection rate, clean claim rate, first-pass resolution, remittance denial rate, net days in A/R, and aged receivables.
Practices may also track unbilled encounters, charge lag, and payer underpayments when those measurements are relevant to their operations.
How often should a medical billing dashboard be updated?
Practice owners should review a finalized dashboard at least monthly.
Billing teams may need more frequent operational reporting for denials, rejected claims, pending charges, and accounts approaching filing or appeal deadlines.
The appropriate frequency depends on the practice’s size, claim volume, and billing workflow.
Can a medical billing dashboard help identify revenue leakage?
Yes. A dashboard can highlight warning signs such as increasing denials, aging A/R, unresolved unbilled encounters, and possible payer underpayments.
However, the dashboard identifies potential problems rather than proving that every outstanding amount is collectible.
Detailed claim reviews and audits are often needed to determine whether reimbursement can be recovered.
What is the difference between a billing dashboard and an A/R report?
An A/R report focuses on outstanding balances and how long they have remained unpaid.
A medical billing dashboard provides a broader view of financial performance, including collections, claim accuracy, denials, charge lag, payer performance, and A/R trends.
Both are useful, but they answer different management questions.
Can small medical practices use billing dashboards?
Yes. Small practices can benefit from dashboards without purchasing expensive analytics software.
A basic report created from existing billing system exports and a spreadsheet may be sufficient to track essential KPIs.
As the practice grows, reporting can become more detailed and automated.
The most important requirements are accurate data, consistent calculations, and useful insights.
How can PROMBS help improve medical billing reporting?
PROMBS supports healthcare practices through customized revenue cycle reporting, KPI tracking, denial analysis, payment posting, and A/R follow-up.
Our services help practices understand where reimbursement is delayed, investigate recurring billing problems, and monitor financial performance more consistently.
Get Better Visibility Into Your Practice Revenue With PROMBS
A medical practice cannot improve what it cannot clearly measure.
Total collections alone do not reveal whether claims are being submitted accurately, insurance denials are increasing, or outstanding reimbursement is becoming harder to recover.
A well-organized medical billing performance dashboard brings these measurements together so practice owners can see how their revenue cycle is performing.
The most useful dashboards do more than display financial results. They help identify problems, explain changes, and support informed decisions about billing operations.
By reviewing collections, claim quality, denials, payer performance, and accounts receivable every month, practices can recognize warning signs and address preventable revenue delays.